What Is Link to Infographics? How to Create Visuals from URLs
Disclosure: this article contains an affiliate link. If you buy through it, we may earn a commission.
A link to infographics is a digital tool that turns external web addresses, articles, or research reports into finished visual charts. It functions as a prompt studio where you paste a URL and answer three simple questions to generate publication-grade images, complete with verified data and source citations.
How Link to Infographics Streamlines Design
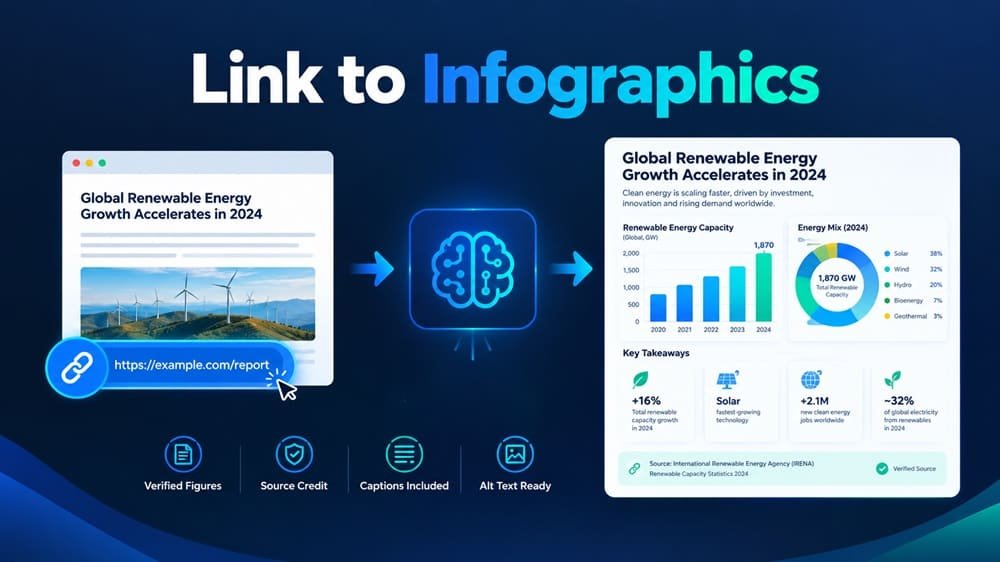
Many content creators struggle to turn dry text or complex reports into engaging visual assets. Instead of manually designing charts or taking screenshots of someone else’s work, this system automates the process. When you provide a link, the software extracts the core information and maps it into a professional layout.
The primary benefit is that it saves time on both research and design. You don’t have to hunt for stats or spend hours in graphic design software to align bars and labels. Because the system handles the data plotting, the output remains consistent and readable. It’s designed for anyone who publishes data regularly, such as bloggers, agency owners, or those selling private label rights (PLR) content.
A common mistake is assuming that automated tools lack customization. In reality, you should check the output against your brand guidelines immediately. If the font size is too small for mobile viewing, adjust the template settings before exporting. If you’re creating content for LinkedIn, use the square format; for Instagram Stories, switch to the vertical layout.
By using Link to Infographics, you get files that are ready for immediate use. The system provides separate files for different sizes, ensuring your images look correct on social media, websites, or email newsletters. Because the images include source lines, they maintain the credibility of your original research without requiring extra manual formatting.
Who Benefits Most from Automated Data Visualization
If your daily workflow involves summarizing reports or turning long-form articles into quick insights, this tool acts as a support system. It’s particularly useful for people who need to scale their content production without hiring a full team of designers.
Bloggers and Content Marketers
For those managing active blogs, visual appeal is essential for keeping readers engaged. Long blocks of text often go unread, but a well-designed infographic captures attention immediately. By converting your latest post or a relevant industry study into an infographic, you increase the likelihood that your content gets shared. It turns a static link into a piece of visual media that stands out in a crowded feed.
Agencies and Service Providers
Agencies often need to produce high-quality reports for multiple clients simultaneously. When you can quickly transform a client’s data or a market report into a branded graphic, you save significant billable hours. Since the system outputs finished files rather than just ideas or prompts, you can move from a raw URL to a final deliverable in minutes.
PLR Sellers and Content Creators
If you sell digital products or content bundles, having high-quality graphics increases the value of your packages. This tool allows you to generate professional assets that you can include as part of your own commercial offerings. Because the system includes full PLR rights, you’re free to rebrand the output or sell the assets as part of your own products. This creates a unique revenue stream for those who understand how to bundle data-heavy content for other business owners.
Understanding the Output and Customization
The system focuses on producing finished, high-quality images rather than just giving you a starting point. When you paste your link and respond to the three required prompts, the software identifies the key figures and arranges them into a clean, professional format.
Why Verified Data Matters
Accuracy is a major concern when publishing data. The U.S. Bureau of Labor Statistics provides guidelines on how to present statistical information clearly and accurately for public consumption. A system that keeps the source line on the image ensures that your readers know exactly where the information originated. This builds trust with your audience, as they can verify the data points themselves if they choose.
Handling Different File Sizes
One of the most common mistakes in visual publishing is using a single image size for every platform. An infographic that works well on a wide desktop screen often looks unreadable on a mobile device or a square social media feed. The system solves this by delivering separate files for every size. This ensures you have the right dimensions for every channel without needing to resize or crop the image yourself.
Customization and Rebranding
You have the option to keep the output as is or rebrand the system’s content to fit your own business. This is useful if you want to create a consistent look across all your marketing materials. By controlling the presentation of the data, you ensure that the final infographic aligns with your brand’s specific style and professional requirements.
Troubleshooting Common Content Obstacles
Even with automation, there are practical limits to what a software tool can do. Recognizing these constraints ensures you achieve consistent, high-quality results.
Why Some Links Produce Better Results
The tool works by identifying and extracting data from the page you provide. Links that contain clear, structured data—such as reports, studies, or articles with bulleted statistics—will produce the most detailed infographics. If you provide a link to a page with very little data or poorly structured content, the system will have less information to work with. Before pasting a link, check that the page actually contains the figures you want to visualize.
Managing Expectations for Complex Data
While the software is adept at plotting figures, extremely dense or highly technical datasets might require a simple summary. If a report has dozens of variables, the tool will prioritize the most prominent numbers. You should aim to provide links that feature a clear narrative or a core set of statistics to ensure the final infographic remains easy to read.
Ensuring Consistency Across Infographics
If you’re building a series of infographics, try to use sources with similar data types. This allows the system to maintain a consistent visual rhythm across your campaign. If you jump between widely different formats, the visual style might vary more than you intend. Using a consistent input structure helps the output stay predictable.
When Is This Tool Not the Right Fit?
This software is designed for speed and automated data visualization. However, it isn’t a replacement for a custom graphic designer if you have very specific, complex needs.
Custom branding requirements often expose the tool’s limits. If your brand guidelines mandate unique, hand-drawn illustrations that fall outside standard chart templates, the software will fail to capture your identity. You’ll end up with generic assets that dilute your brand equity.
Highly abstract data also presents a barrier. If your content relies on metaphors, conceptual storytelling, or qualitative insights rather than raw numbers, the tool will struggle. It lacks the semantic understanding required to visualize ideas that don’t have a clear X or Y axis.
Deep creative control remains the final hurdle. If your workflow requires manipulating individual pixels, layers, or custom vector paths, the automated layout engine will frustrate you. When you need to deviate from the provided grid, the tool forces you into a rigid structure.
Before buying, look at the actual output examples. If these examples match your desired aesthetic, you’ll save hours of production time. If you require a bespoke look, hire a designer. The decision rule is simple: if your project requires a unique visual narrative, avoid automation. Using the wrong tool here costs you both time and the professional polish your audience expects.
Related guides
Frequently Asked Questions
Does the system require a subscription to use?
The details regarding access and payment terms are provided on the official product page. It’s important to review the specific terms of the offer before you complete your purchase to ensure you understand how the access is granted and if there are any recurring costs associated with the platform.
Can I change the colors of the infographics?
The system is designed to output professional, finished files based on your input. While it creates high-quality images, the level of visual customization depends on the features currently enabled in the prompt studio. Always check the latest product specifications to confirm if specific branding colors are supported in your version.
Do I own the rights to the images I create?
Yes, the system provides full PLR rights for the infographics you generate. This means you’re permitted to use the images for your own projects, rebrand them as your own, or sell them as part of a product package. This is a primary feature for those who create content for clients.
Will the system work with any website link?
The tool works best with links that contain clear, extractable data like reports, studies, or articles. If a website is heavily encrypted, behind a complex login, or lacks clear numerical data, the software may struggle to pull the necessary information to build a complete infographic.
What should I look for before buying?
You should confirm that the output style matches the visual needs of your brand. Since the system produces finished files, you should view the available examples to ensure the layout, data presentation, and overall aesthetic align with what you intend to publish on your website or social media channels.
Conclusion
The best way to use this tool is to integrate it into a routine where you’re already processing reports or research. If you regularly need to communicate data to an audience, Link to Infographics will remove the technical barriers between a raw link and a finished visual. Try it with a single, data-rich article to see how quickly you can produce your first set of images.